Unlocking the Sun’s Power: Your Guide to the Solar Irradiance Index and Why It Matters.
Understanding the sun’s energy isn’t just for astronomers – it’s crucial for designing efficient solar power systems, optimizing building energy use, predicting weather, and even planning agricultural cycles. At the heart of this understanding lies the Solar Irradiance Index (often referred to simply as solar irradiance data or solar resource data). This comprehensive guide demystifies solar irradiance indices, explains their critical importance, and shows you how to access and utilize this powerful data.
What Exactly is Solar Irradiance? The Foundational Concept
Before diving into indices, let’s grasp the core concept:
Solar Irradiance: This is the power per unit area received from the Sun in the form of electromagnetic radiation, typically measured just outside Earth’s atmosphere or at the Earth’s surface. Think of it as the sun’s “brightness” in energy terms hitting a specific spot.
Units: The standard unit is Watts per square meter (W/m²).
Key Insight: It’s not constant. Irradiance fluctuates based on:
Time of Day: Highest at solar noon, zero at night.
Time of Year: Varies with Earth’s tilt and orbital position (seasons).
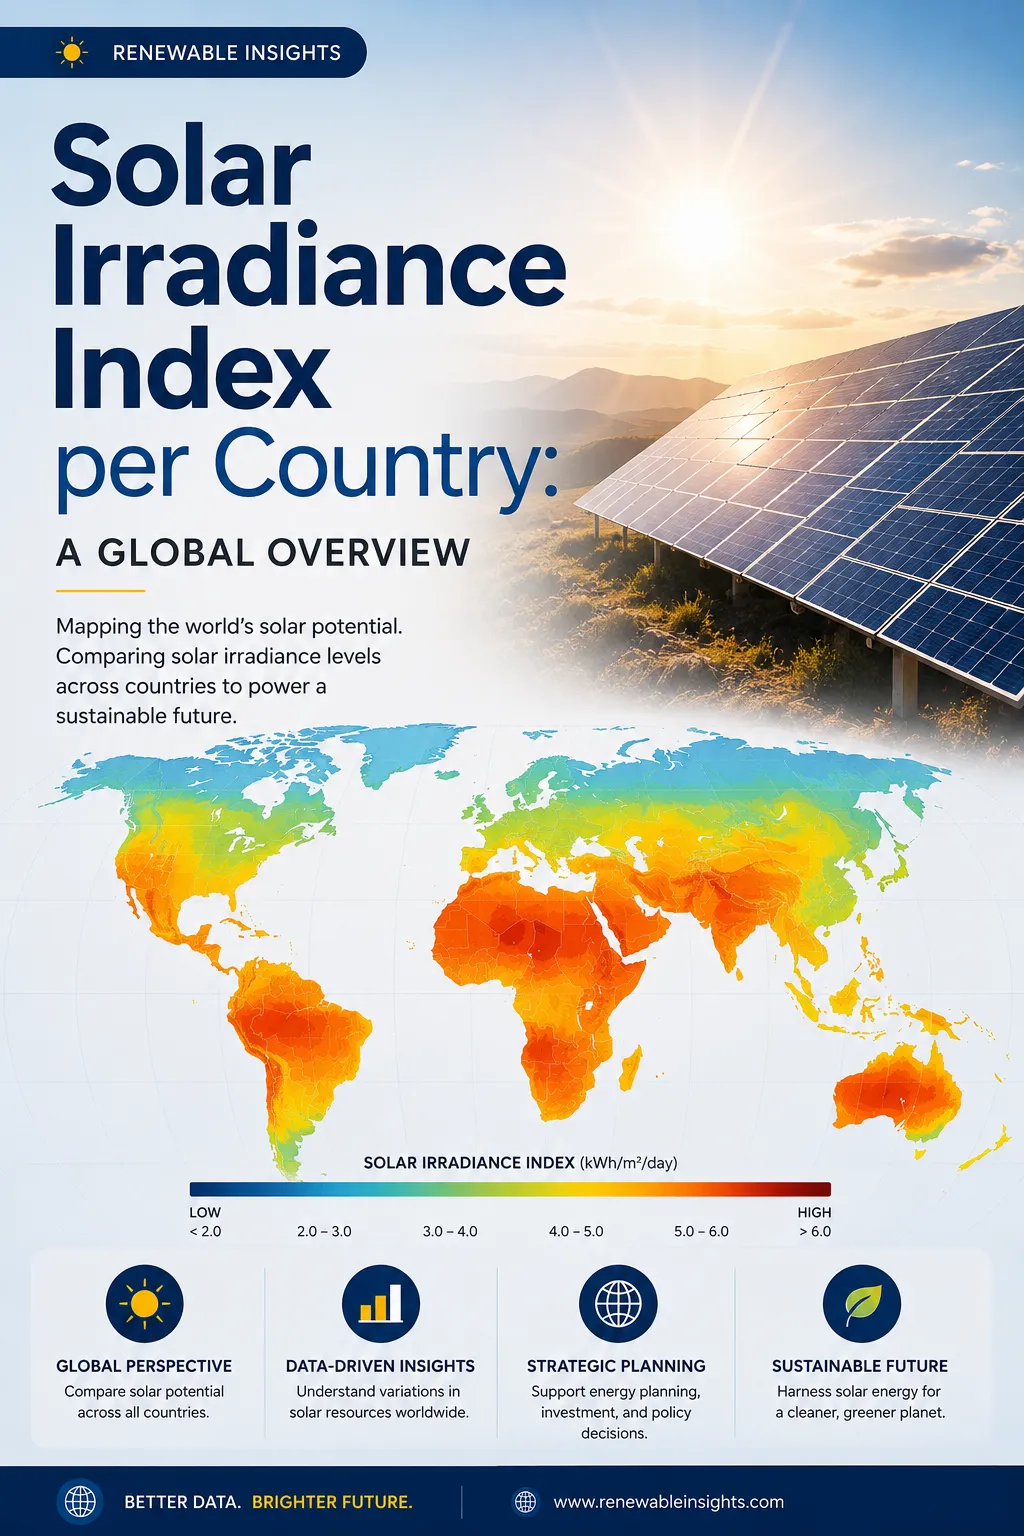
Geographic Location: Latitude significantly impacts average annual irradiance. The equator receives far more than the poles.
Atmospheric Conditions: Clouds, aerosols (dust, pollution), water vapor, and ozone absorb and scatter sunlight, drastically reducing surface irradiance. This is where the “index” aspect becomes vital.
Demystifying the “Solar Irradiance Index”
Strictly speaking, there isn’t a single, universally defined “Solar Irradiance Index” like the Dow Jones. Instead, the term broadly encompasses key measurements and derived datasets used to quantify the solar resource available at a specific location and time. Think of it as the suite of metrics we use to index the sun’s energy potential.
The Core Components: GHI, DNI, DIF
Any meaningful solar irradiance dataset will distinguish between three fundamental components:
Global Horizontal Irradiance (GHI):
What it is: The total solar radiation received on a horizontal surface at the Earth’s surface. It includes both:
Direct Normal Irradiance (DNI): Radiation coming directly from the sun’s disk.
Diffuse Horizontal Irradiance (DIF): Radiation scattered by the atmosphere (clouds, molecules, aerosols).
Formula: GHI = DNI * cos(θ) + DIF (Where θ is the solar zenith angle – the angle between the sun and the vertical).
Primary Use: Estimating energy production for fixed-tilt (often optimally angled) or horizontal solar panels, like many rooftop photovoltaic (PV) systems. It’s the most commonly reported “solar index” value for general site assessment.
Source: National Renewable Energy Laboratory (NREL) – Solar Radiation Basics
Direct Normal Irradiance (DNI):
What it is: The solar radiation coming directly from the sun’s disk, measured on a surface perpendicular to the sun’s rays. Think of it as the intense beam of sunlight.
Why it matters: This is the only component usable by concentrating solar power (CSP) technologies (like solar towers or parabolic troughs) that focus sunlight using mirrors. It’s also crucial for high-efficiency PV systems that use trackers to follow the sun.
Sensitivity: DNI is highly sensitive to atmospheric clarity. Even thin clouds can drastically reduce it.
Source: International Energy Agency (IEA) – SolarPACES (Concentrating Solar Power)
Diffuse Horizontal Irradiance (DIF):
What it is: The solar radiation reaching the Earth’s surface after being scattered by molecules, aerosols, and clouds in the atmosphere. It comes from all directions in the sky dome, not just the sun’s disk.
Importance: This is the component that allows solar panels to still produce some power on cloudy days, albeit significantly less. Systems without trackers rely more heavily on the diffuse component when the sun isn’t direct.
Why the Solar Irradiance Index is CRITICAL
Accessing accurate irradiance data isn’t an academic exercise; it has massive real-world implications:
Solar Energy Project Feasibility & Design:
Financial Viability: Accurate long-term average GHI/DNI is the primary input for calculating the Energy Yield of a proposed solar farm (PV or CSP). This directly impacts project financing, Power Purchase Agreement (PPA) pricing, and return on investment (ROI). Underestimating leads to financial risk; overestimating leads to disappointed investors.
System Sizing: Determines how many solar panels or how much mirror area is needed to meet energy production targets.
Technology Choice: High DNI sites favor CSP; sites with high diffuse components might favor certain PV technologies. Tracking systems become more valuable in high-DNI regions.
Resource: PVWatts® Calculator (NREL) – Uses irradiance data to estimate PV system production.
Building Energy Efficiency & Design:
Passive Solar Design: Architects use irradiance data to optimize window placement, shading structures, and thermal mass to naturally heat and cool buildings, reducing HVAC loads.
Daylighting: Predicting available natural light (linked to diffuse irradiance) informs window sizing and placement to minimize electric lighting use.
Cooling Load Calculations: Peak solar irradiance drives peak cooling demands in buildings. Accurate data is essential for sizing air conditioning systems.
Agriculture:
Evapotranspiration Models: Solar irradiance is a primary driver of crop water use. Accurate data improves irrigation scheduling and water management.
Crop Growth & Yield Prediction: Sunlight is fundamental to photosynthesis. Irradiance data feeds into models predicting crop development stages and potential yields.
Resource: Food and Agriculture Organization (FAO) – Crop Evapotranspiration
Weather Forecasting & Climate Modeling:
Short-Term Forecasts: Solar irradiance impacts local temperatures, cloud formation, and wind patterns. Accurate forecasting requires modeling incoming solar energy.
Climate Studies: Long-term irradiance datasets are vital for understanding Earth’s energy balance, climate change trends, and validating climate models.
Resource: NASA POWER Project – Meteorology Data
Material Science & Durability Testing:
Products exposed to sunlight (paints, plastics, fabrics) are tested under controlled irradiance levels to predict lifespan and degradation. Standards like ASTM G173 define reference spectra.
Where to Find Reliable Solar Irradiance Index Data (Key Sources)
Thankfully, numerous high-quality, often free, sources exist:
National Renewable Energy Laboratory (NREL) – U.S. & Global Leader:
NSRDB (National Solar Radiation Database): The gold standard for the US. Provides long-term (30+ year) hourly time series of GHI, DNI, DIF, and more at ~4km resolution. Access via:
PVWatts® Calculator: Simplifies system production estimates using NSRDB data.
International Solar Resource Data: NREL also curates and provides global datasets.
NASA – Global Perspective from Space:
POWER Project (Prediction Of Worldwide Energy Resources): Provides daily and monthly averaged irradiance data globally (~1 degree resolution), along with crucial meteorological data. Excellent for feasibility studies outside the US. NASA POWER Data Access
Satellite-Derived Datasets: Missions like CERES and MODIS provide global irradiance measurements.
World Bank Group – Global Solar Atlas:
Global Solar Atlas: An intuitive, map-based tool providing long-term average yearly and monthly GHI and DNI globally. Ideal for quick site screening and comparisons. Includes PV power potential outputs. Global Solar Atlas
European Commission – PVGIS (Photovoltaic Geographical Information System):
PVGIS: Provides highly detailed solar radiation data (GHI, DNI, DIF) and PV performance calculations for Europe, Africa, and parts of Asia. Offers historical data and future projections. PVGIS
National Meteorological Services:
Many countries operate ground-based measurement networks (pyranometers for GHI, pyrheliometers for DNI). Data quality is high but spatial coverage is limited to station locations. Check your local Met service website (e.g., NOAA in the US).
Understanding Data Types & Timeframes
Typical Time Series: Data usually comes as:
Long-Term Averages (Yearly/Monthly): Essential for feasibility studies (e.g., “Average Annual GHI is 1800 kWh/m²”).
Hourly or Sub-Hourly Values: Needed for detailed system simulation, grid integration studies, and understanding daily variability.
Typical Year (TMY): A synthetic year of hourly data representing long-term climatic conditions, created by selecting “typical” months from multiple years of data. Crucial for simulations. Often included in NSRDB/PVGIS.
Resolution: Data can be point data (specific station) or gridded (covering an area). Gridded data resolution varies (e.g., 4km for NSRDB US, ~30km for NASA POWER).
Whether you’re a solar developer, an architect, a farmer, a researcher, or simply curious about the sun’s power, knowing where to find and how to interpret solar irradiance data is invaluable. Utilize the powerful, freely available tools from NREL, NASA, the World Bank, and others to unlock the potential of your location under the sun. The future is bright, and it’s powered by data.