Solar irradiance has become one of the most important indicators in the renewable energy industry. Governments, energy companies, infrastructure investors, and solar developers closely monitor the Solar Irradiance Index to identify countries with the highest solar power generation potential. As the global energy transition accelerates, countries with high Global Horizontal Irradiance (GHI) are gaining strategic importance in utility-scale solar projects, rooftop solar installations, and green hydrogen development.
According to research from the Global Solar Atlas and the World Bank, countries located in desert belts, equatorial regions, and arid subtropical climates receive the highest annual solar radiation levels. These regions consistently deliver strong photovoltaic efficiency, higher solar yield, and lower levelized energy costs.
Useful reference resources:
- https://globalsolaratlas.info
- https://www.worldbank.org/en/topic/energy/publication/solar-photovoltaic-power-potential-by-country
- https://solargis.com/resources/free-maps-and-gis-data
- https://www.eia.gov/energyexplained/solar/where-solar-is-found.php
- https://joint-research-centre.ec.europa.eu/photovoltaic-geographical-information-system-pvgis_en
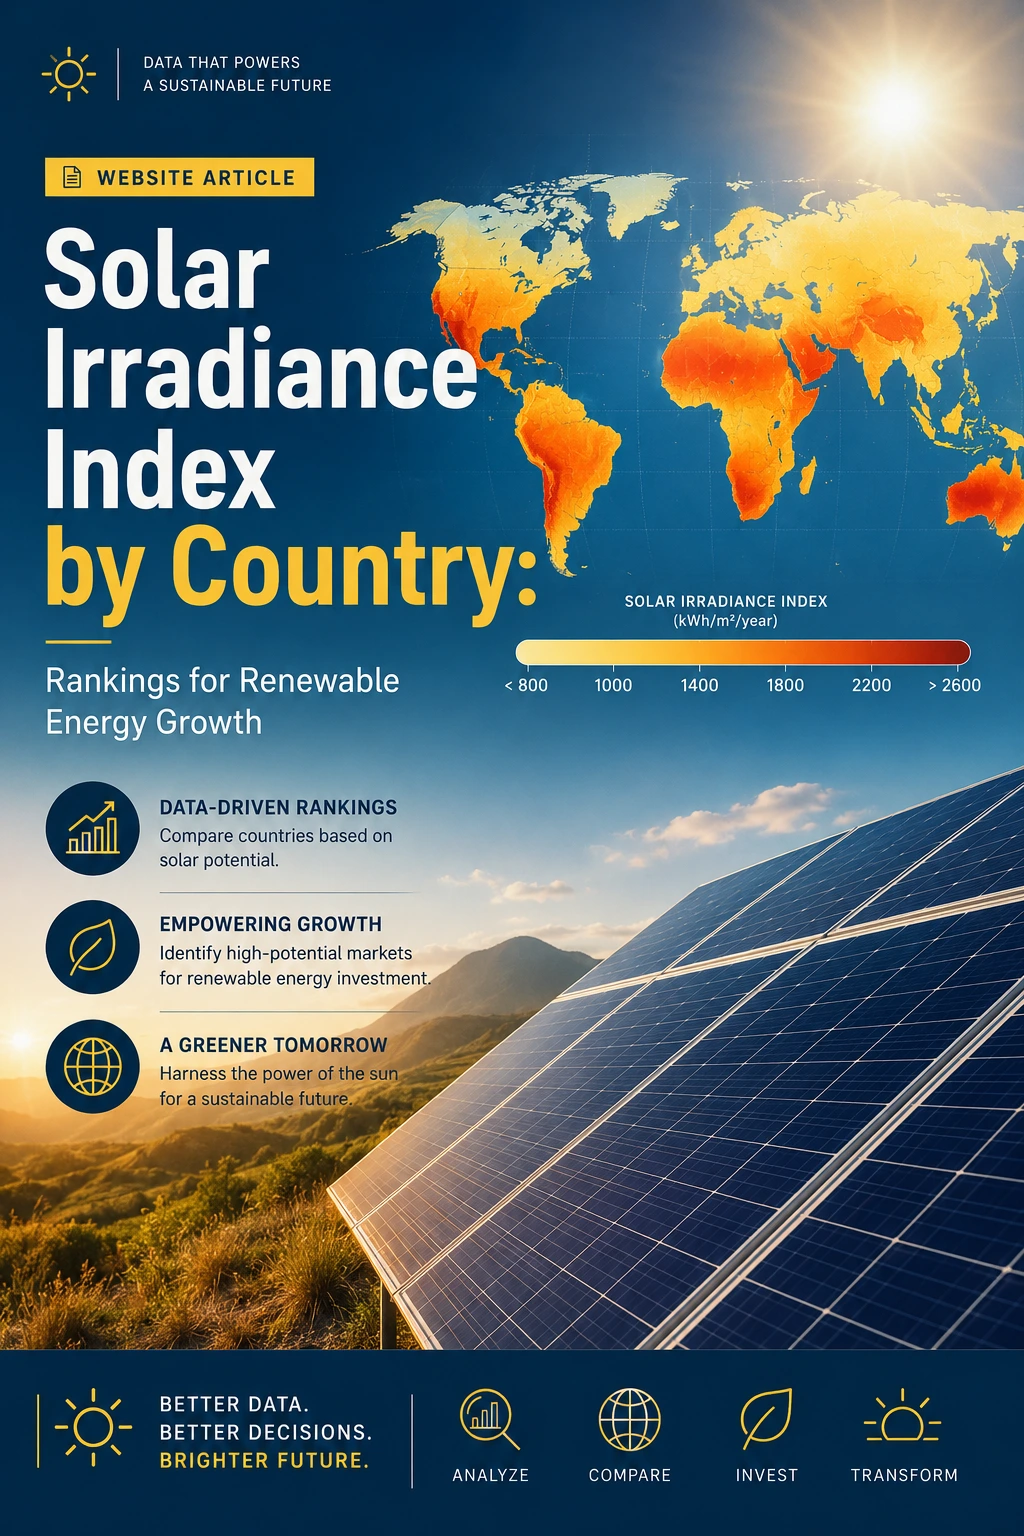
What is the Solar Irradiance Index?
The Solar Irradiance Index measures the amount of solar energy received per square meter of land area over a given time period. It is commonly expressed in kilowatt-hours per square meter per day (kWh/m²/day). The higher the value, the greater the solar power generation potential.
Solar irradiance is generally categorized into:
- Global Horizontal Irradiance (GHI)
- Direct Normal Irradiance (DNI)
- Diffuse Horizontal Irradiance (DIF)
For solar photovoltaic systems, GHI is the most widely used benchmark. Countries with annual average irradiance above 5.5 kWh/m²/day are considered premium solar markets.
Why Solar Irradiance Matters for Renewable Energy Investment
Countries with high solar irradiance benefit from:
- Lower electricity generation costs
- Faster return on investment for solar farms
- Higher solar panel efficiency
- Greater battery storage optimization
- Reduced carbon emissions
- Better renewable energy security
- Stronger clean energy export potential
The rapid growth of solar infrastructure in the Middle East, Africa, Australia, Latin America, and South Asia demonstrates the direct relationship between irradiance levels and renewable energy expansion.
Global Solar Irradiance Rankings by Country
The following ranking is based on long-term Global Horizontal Irradiance averages compiled from solar resource datasets, satellite-based measurements, and international renewable energy assessments.
Very High Solar Irradiance Countries (Above 6.0 kWh/m²/day)
- Namibia
- Chad
- Niger
- Oman
- Saudi Arabia
- Yemen
- Sudan
- Egypt
- Libya
- Algeria
- Somalia
- Mauritania
- United Arab Emirates
- Kuwait
- Qatar
- Bahrain
- Jordan
- Eritrea
- Djibouti
- Mali
- Botswana
- Australia
- Chile
- Peru
- Bolivia
- Mexico
- Afghanistan
- Pakistan
- Iran
- Turkmenistan
- Uzbekistan
- Kazakhstan
- Mongolia
- South Africa
- Morocco
- Tunisia
- Western Sahara
- Ethiopia
- Kenya
- Angola
These countries benefit from dry climates, minimal cloud cover, and high annual sunshine duration. The Sahara Desert, Arabian Peninsula, Australian Outback, and Atacama Desert are globally recognized solar hotspots.
High Solar Irradiance Countries (5.0 – 6.0 kWh/m²/day)
- India
- China
- United States
- Spain
- Portugal
- Greece
- Turkey
- Israel
- Iraq
- Syria
- Azerbaijan
- Armenia
- Georgia
- Brazil
- Argentina
- Paraguay
- Uruguay
- Venezuela
- Colombia
- Ecuador
- Guatemala
- Honduras
- Nicaragua
- El Salvador
- Costa Rica
- Panama
- Dominican Republic
- Cuba
- Jamaica
- Haiti
- Senegal
- Nigeria
- Tanzania
- Zimbabwe
- Zambia
- Mozambique
- Madagascar
- Thailand
- Vietnam
- Cambodia
- Laos
- Myanmar
- Indonesia
- Philippines
- Sri Lanka
- Nepal
- Bangladesh
- Papua New Guinea
- Fiji
- New Caledonia
Countries in this range have excellent solar deployment conditions and are increasingly attracting international renewable energy investment. India, China, Brazil, and the United States are among the largest solar energy markets globally.
Moderate Solar Irradiance Countries (3.0 – 5.0 kWh/m²/day)
- France
- Italy
- Germany
- Netherlands
- Belgium
- Luxembourg
- Austria
- Switzerland
- Poland
- Czech Republic
- Slovakia
- Hungary
- Romania
- Bulgaria
- Croatia
- Serbia
- Bosnia and Herzegovina
- Albania
- North Macedonia
- Montenegro
- Ukraine
- Belarus
- Russia
- Japan
- South Korea
- North Korea
- Taiwan
- Malaysia
- Singapore
- New Zealand
- Canada
- France
- Ireland
- United Kingdom
- Denmark
- Sweden
- Norway
- Finland
- Estonia
- Latvia
- Lithuania
- Iceland
Although these countries have comparatively lower irradiance levels, many remain leaders in solar energy deployment because of advanced technology, government incentives, strong infrastructure, and clean energy policies.
Countries with the Highest Solar Energy Potential
Namibia
Namibia consistently ranks among the best countries globally for solar irradiance. Large desert regions, low humidity, and clear skies create ideal photovoltaic conditions. Utility-scale solar farms in Namibia are increasingly drawing international infrastructure investments.
Saudi Arabia
Saudi Arabia is rapidly transforming into a global renewable energy powerhouse. With vast desert landscapes and high DNI values, the kingdom is investing heavily in giga-scale solar projects under Vision 2030.
Australia
Australia combines high solar exposure with mature energy infrastructure. Regions such as Western Australia and Queensland record some of the world’s highest solar radiation levels.
Chile
The Atacama Desert in Chile is widely recognized as one of the sunniest places on Earth. Solar farms in northern Chile deliver exceptionally high energy yields and support South America’s renewable transition.
India
India has emerged as one of the fastest-growing solar energy markets. Rajasthan, Gujarat, and Ladakh receive strong solar radiation and support massive utility-scale solar parks.
Useful solar energy policy resources:
- https://www.irena.org
- https://www.iea.org/topics/solar-pv
- https://www.nrel.gov
- https://www.energy.gov/eere/solar
- https://www.solarpowereurope.org
Global Solar Irradiance Rankings Overview
The following countries generally rank highly for average annual solar irradiance:
| Country | Average Solar Irradiance (kWh/m²/day) | Solar Potential |
|---|---|---|
| Australia | 5.5 – 6.5 | Extremely High |
| Saudi Arabia | 5.5 – 6.2 | Extremely High |
| India | 4 – 7 | Very High |
| Chile | 5 – 6.5 | Extremely High |
| United States | 4 – 6.5 | Very High |
| UAE | 5.5 – 6.3 | Extremely High |
| Egypt | 5 – 6 | High |
| Mexico | 5 – 6 | High |
| South Africa | 4.5 – 6 | High |
| Spain | 4 – 5.5 | Moderate to High |
Data trends are compiled using research references from the Global Solar Atlas, IRENA, and various meteorological agencies.
Key Factors Affecting Solar Irradiance
Several environmental and geographic variables influence solar irradiance:
1. Latitude
Countries located closer to the equator generally receive more direct sunlight throughout the year.
2. Cloud Cover
Regions with low cloud density experience higher annual solar radiation.
3. Atmospheric Conditions
Dust, pollution, humidity, and aerosols can reduce solar panel efficiency.
4. Elevation
High-altitude regions often receive stronger solar intensity because of thinner atmospheric layers.
5. Seasonal Variability
Countries with low seasonal fluctuations offer more stable photovoltaic generation profiles.
Solar Irradiance and the Future of Clean Energy
Global electricity demand continues to rise, making solar power one of the fastest-growing energy sources in the world. Nations with high solar irradiance are expected to dominate future renewable energy infrastructure investments, battery storage deployment, green hydrogen production, and carbon-neutral industrial development.
The International Energy Agency projects that solar photovoltaic energy will become the largest source of electricity generation globally within the next few decades. Falling solar panel costs, improving battery technologies, and government decarbonization targets continue to strengthen the economics of solar deployment.
Emerging markets in Africa, the Middle East, South Asia, and Latin America are especially well positioned due to their natural solar resource advantages.
Final Analysis
The Solar Irradiance Index is becoming a foundational metric for evaluating long-term energy competitiveness. Countries with high annual solar radiation possess a major strategic advantage in the global clean energy economy. Regions such as North Africa, the Middle East, Australia, South America, and South Asia are expected to remain central hubs for utility-scale solar development.
Meanwhile, technologically advanced economies with moderate irradiance continue to accelerate solar adoption through policy innovation, smart grids, energy storage systems, and advanced photovoltaic technologies.
As renewable energy investment expands worldwide, solar irradiance data will remain essential for policymakers, investors, infrastructure developers, and sustainability analysts seeking to identify the next generation of high-growth solar markets.
Read also
- https://ourworldindata.org/renewable-energy
- https://ember-energy.org
- https://www.iea.org/reports/renewables-2025
- https://www.unep.org
- https://www.energy.gov/solar
- https://www.cleanenergywire.org
- https://www.power-technology.com
- https://www.pv-magazine.com
- https://www.greentechmedia.com
- https://www.bloomberg.com/energy