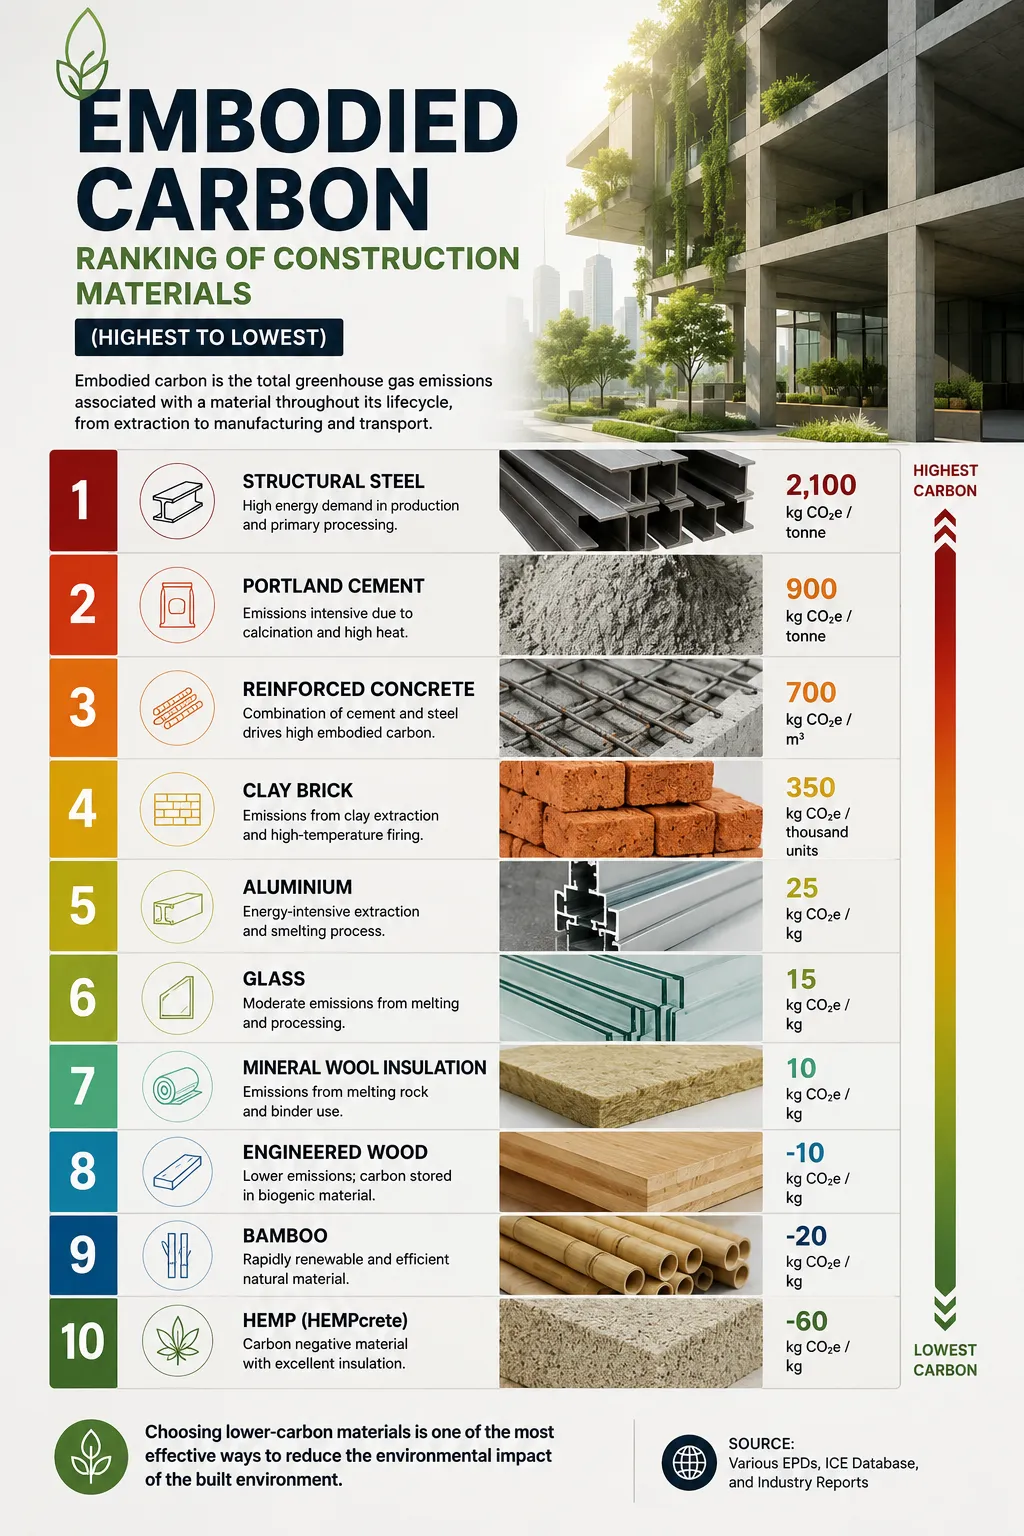
| Rank | Material | Typical Embodied Carbon (kg CO₂e/kg) |
|---|---|---|
| 1 | Primary Aluminium | 8–18 |
| 2 | Stainless Steel | 5–7 |
| 3 | Carbon Steel | 1.7–2.8 |
| 4 | Plastics | 2–6 |
| 5 | Portland Cement | 0.75–0.95 |
| 6 | Glass | 0.8–1.5 |
| 7 | Fired Clay Brick | 0.20–0.45 |
| 8 | Gypsum Board | 0.20–0.35 |
| 9 | Concrete | 0.08–0.20 |
| 10 | Natural Stone | 0.05–0.20 |
| 11 | Engineered Timber | 0.05–0.15 |
| 12 | Solid Timber | 0.02–0.10 |
How to calculate embodied carbon emissions
Embodied carbon is in essence the carbon footprint of a material, or cumulatively, a building. To calculate these emissions, multiply the quantity of the material (e.g. steel or concrete) by its carbon factor – the amount of carbon released in the creation/production of the material up to this point.
Reference: What is embodied carbon (and what can we do about it)?
1. Aluminium — Highest Embodied Carbon
Typical Embodied Carbon: 8–18 kg CO₂e/kg (Primary Aluminium)
Primary aluminium consistently ranks as the most carbon-intensive mainstream construction material because of its energy-intensive electrolysis process.
Key Findings
- Extremely high electricity demand during smelting.
- Carbon footprint varies significantly depending on electricity source.
- Hydropower-based production can reduce emissions substantially.
- Recycled aluminium lowers embodied carbon by nearly 90–95%.
Best Applications
- Curtain walls
- Window framing
- Architectural facades
References
- https://circularecology.com/embodied-carbon-footprint-database.html
- https://www.buildingtransparency.org/tools/ec3/
- https://carbonleadershipforum.org/ec3-tool/
2. Stainless Steel
Typical Embodied Carbon: 5–7 kg CO₂e/kg
Stainless steel contains chromium and nickel, both requiring energy-intensive extraction and processing.
Key Findings
- Higher emissions than carbon steel.
- Recycling significantly lowers impacts.
- Long service life offsets replacement emissions in many applications.
3. Carbon Steel
Typical Embodied Carbon: 1.7–2.8 kg CO₂e/kg
Steel remains one of the largest contributors to embodied carbon because of the enormous quantities used in buildings.
Key Findings
- Blast furnace production has the highest emissions.
- Electric Arc Furnace (EAF) steel using recycled scrap dramatically reduces carbon footprint.
- Responsible for a significant proportion of structural embodied carbon.
4. Cement (Ordinary Portland Cement)
Typical Embodied Carbon: 0.75–0.95 kg CO₂e/kg
Cement production accounts for approximately 7–8% of global CO₂ emissions due to limestone calcination and kiln fuel consumption.
Key Findings
- Cement is considerably more carbon-intensive than concrete on a per-kilogram basis.
- Supplementary Cementitious Materials (SCMs) such as fly ash and GGBS substantially reduce emissions.
- Low-clinker cement technologies continue to improve carbon performance.
5. Plastics & Polymer-Based Construction Products
Typical Embodied Carbon: 2–6 kg CO₂e/kg
Plastic products originate primarily from petrochemical feedstocks.
Key Findings
- High manufacturing energy demand.
- Difficult end-of-life management.
- Carbon footprint varies considerably by polymer type.
Examples include:
- PVC
- HDPE
- Polycarbonate
- Acrylic panels
6. Glass
Typical Embodied Carbon: 0.8–1.5 kg CO₂e/kg
Glass manufacturing requires continuous high-temperature furnaces.
Key Findings
- Float glass production is energy intensive.
- Triple glazing improves operational efficiency but increases embodied carbon.
- Recycled cullet reduces production emissions.
7. Fired Clay Bricks
Typical Embodied Carbon: 0.20–0.45 kg CO₂e/kg
Kiln firing dominates brick emissions.
Key Findings
- Manufacturing fuel determines carbon intensity.
- Local sourcing reduces transportation impacts.
- Fly ash bricks generally outperform fired clay bricks.
8. Concrete
Typical Embodied Carbon: 0.08–0.20 kg CO₂e/kg
Although concrete has relatively low emissions per kilogram, it is the world’s most widely consumed construction material, making its total climate impact extremely significant.
Key Findings
- Cement content determines overall embodied carbon.
- SCM substitution offers immediate reductions.
- Carbon-cured concrete technologies are emerging rapidly.
9. Gypsum Board (Drywall)
Typical Embodied Carbon: 0.20–0.35 kg CO₂e/kg
Key Findings
- Moderate manufacturing emissions.
- Increasing recycled gypsum content lowers impacts.
- Lightweight products reduce transport emissions.
10. Natural Stone
Typical Embodied Carbon: 0.05–0.20 kg CO₂e/kg
Key Findings
- Quarrying dominates emissions.
- Minimal processing compared with manufactured materials.
- Local stone generally offers lower embodied carbon than imported alternatives.
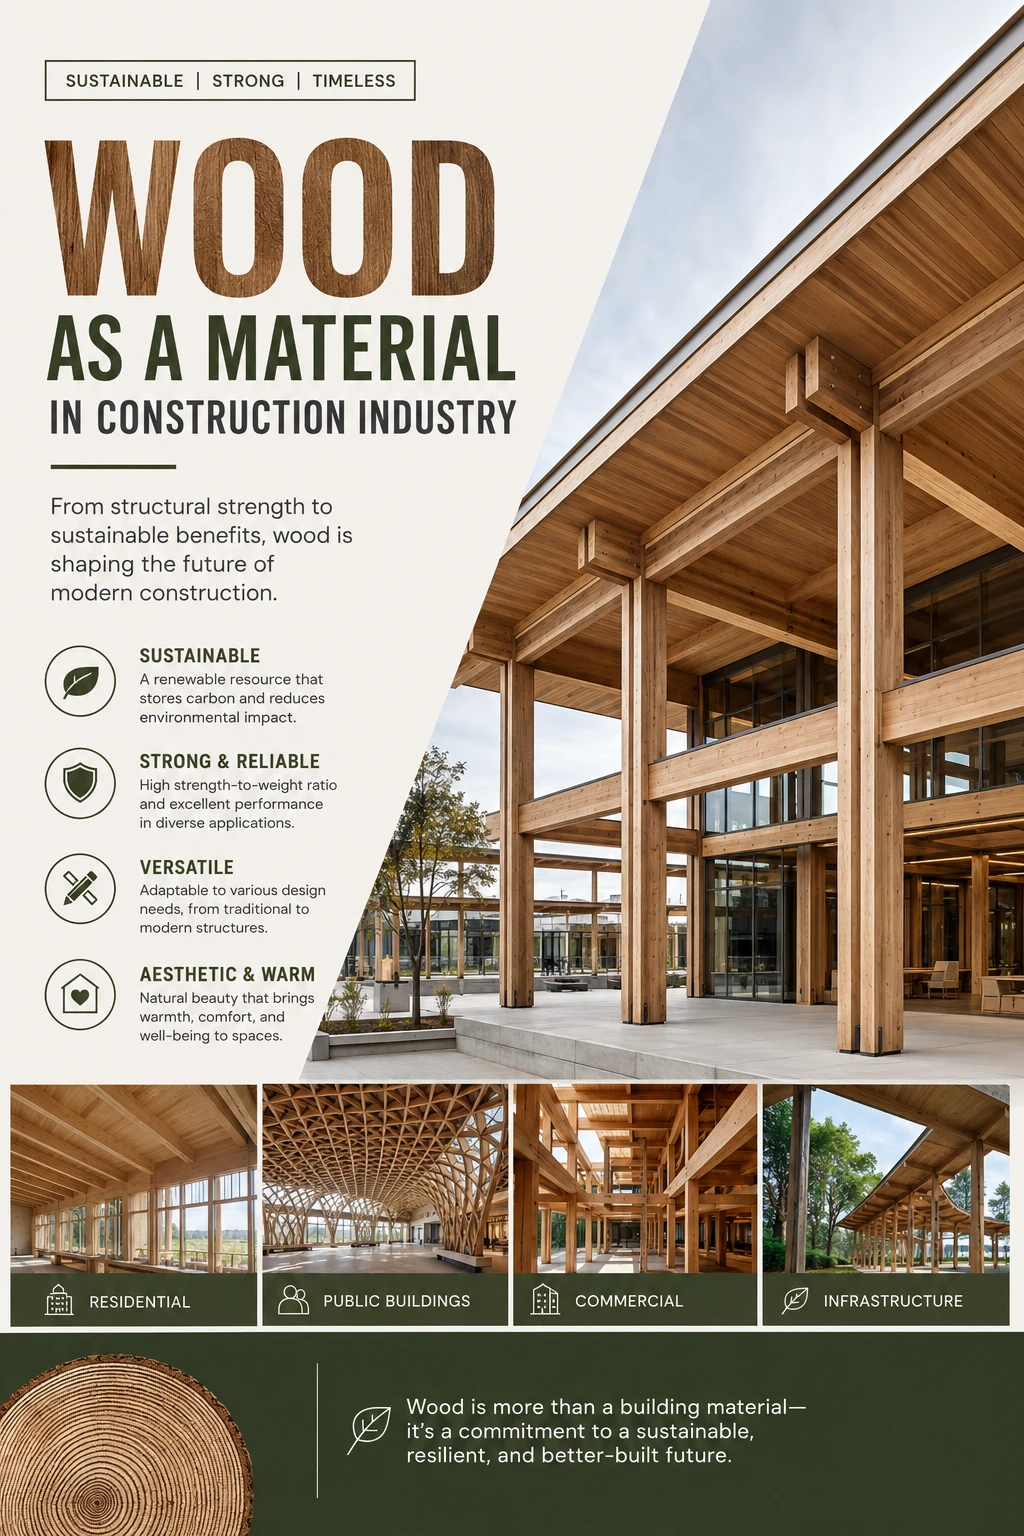
11. Engineered Timber (CLT, Glulam)
Typical Embodied Carbon: 0.05–0.15 kg CO₂e/kg
Engineered timber is among the lowest-carbon structural materials currently available.
Key Findings
- Stores atmospheric carbon during tree growth.
- Requires significantly less manufacturing energy than steel or concrete.
- Sustainable forestry certification is essential for long-term environmental performance.
12. Solid Timber — Lowest Embodied Carbon
Typical Embodied Carbon: 0.02–0.10 kg CO₂e/kg
Solid timber consistently ranks among the lowest embodied carbon construction materials.
Key Findings
- Renewable resource.
- Minimal processing energy.
- Excellent carbon storage potential.
- Particularly suitable for low-rise residential and hybrid structures.
See also:
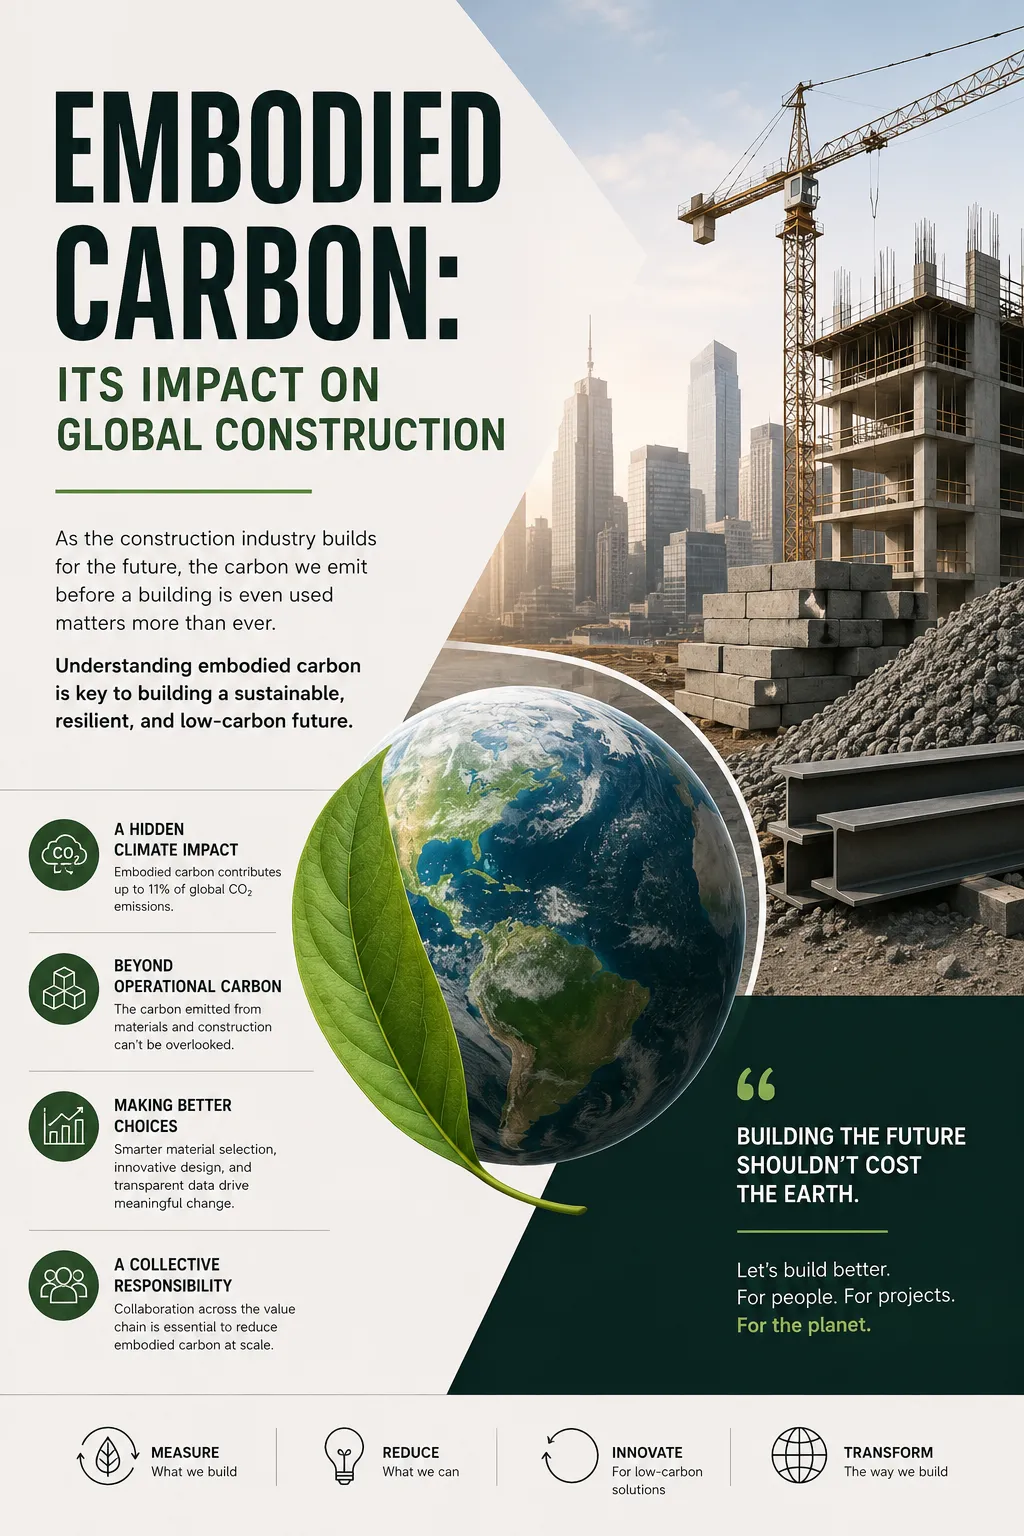
Embodied Carbon: Its Impact on Global Construction
Top 10 ways to reduce embodied carbon through built environment
One thought on “Embodied Carbon Ranking of Construction Materials (Highest to Lowest)”